
#TopBot Levels
Data-driven institutional top and bottom projection
3/17/20261 min read
Introduction
In today's fast-moving financial markets, traders face an overwhelming flood of information. Knowing where price is likely to reverse, stall, or accelerate is the difference between a disciplined trade and a costly mistake. TopBot Levels is a precision trading tool built by Faiter Technology that answers this question with mathematical clarity — defining the outer boundaries of normal price movement for any instrument, on any timeframe.
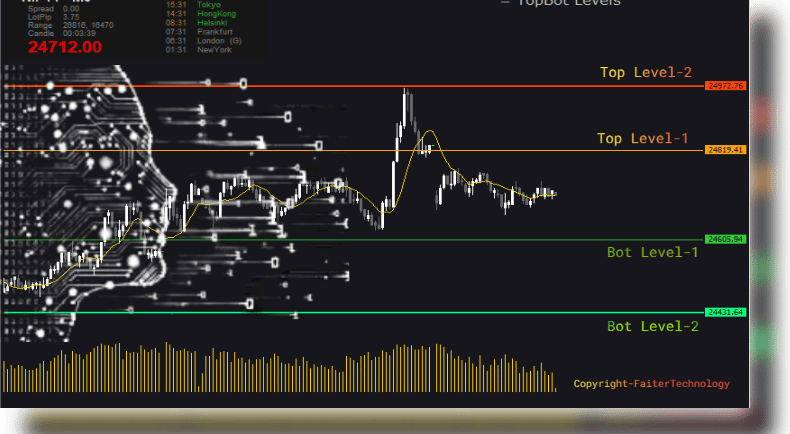
Combining two proven techniques — the Arnaud Legoux Moving Average (ALMA) as a dynamic centerline and ATR-based Keltner Channel bands as volatility envelopes — TopBot Levels plots four key price zones directly on your chart: two upside resistance levels and two downside support levels. These are not arbitrary lines. They are statistically derived boundaries that tell you, in real time, how far price typically stretches before it exhausts.
The Methodology Behind TopBot Levels
1. ALMA — The Adaptive Centerline
At the heart of TopBot Levels is the Arnaud Legoux Moving Average (ALMA), a moving average designed to reduce lag while minimising noise. Unlike a simple or exponential moving average, ALMA uses a Gaussian distribution curve to assign weights to price bars, placing greater emphasis on recent prices while smoothing out erratic short-term fluctuations.
This gives traders a clean, responsive centerline that tracks the market's true directional bias. Price trading above the ALMA centerline suggests bullish control; price below suggests bearish pressure. TopBot Levels uses two separate ALMA calculations — an inner ALMA with a shorter lookback for faster response, and an outer ALMA with a longer lookback for structural context.